Greenhouse Gas Emissions
Formosa Laboratories has been conducting greenhouse gas inventories in accordance with ISO 14064-1:2018 standards since 2022. Additionally, Formosa Laboratories performs a greenhouse gas inventory each year, starting with 2022 as the base year, and undergoes third-party verification to monitor our carbon emission hotspots and reduction results. In 2024, the total greenhouse gas emissions at Formosa Laboratories were 58,958.07145 metric tons of CO2e. The increase in emissions was mainly due to equipment and instrument procurement for plant expansion and a rise in overall electricity consumption. However, the Scope 1 and 2 greenhouse gas emission intensity was 8.06 metric tons of CO2e per NT$ million, remaining lower than the previous year.
▼Greenhouse gas emissions at Formosa Laboratories over the past two years (Unit: metric tons of CO2e)
 Note:
Note:- Greenhouse gas emissions were compiled using the operational control method. The entire area of Formosa Laboratories, including Luzhu Plant and Luzhu No. 2 Plant, was used as the boundary. Greenhouse gas inventories were conducted following the methodology specified in the ISO 14064-1:2018 standards. Only some items in Categories 3 and 4 were surveyed in the Scope 3 greenhouse gas emissions inventory (Categories 3 to 6).
- The data varied because the global warming potential (GWP) for each type of greenhouse gas was estimated using the GWP values from the IPCC Sixth Assessment Report, which differed from the values in the IPCC Fourth Assessment Report as adopted by the Ministry of Environment.
- The electricity carbon emission factors published by the Energy Administration were used in the data above, where the factors for 2022 and 2023 were 0.495 and 0.494 kg of CO2e per kWh, respectively, and for 2024 they were 0.474 of CO2e per kWh.
- Greenhouse gas emission intensity = Scope 1 and 2 greenhouse gas emissions (tons of CO2e) per unit of revenue (NT$ million). The source of revenue data was Formosa Laboratories' standalone financial statements, where Formosa Laboratories generated a revenue of NT$3,804.145 million in 2022, NT$4,346.290 million in 2023 and NT$4,605.182 million in 2024, which were rounded to two decimal places.
- Formosa Laboratories received the ISO 14064-1 Greenhouse Gas Verification Statement after third-party organization SGS Taiwan verified the greenhouse gas inventory data for 2022 and 2024.
- The business travel activity data for 2023-2024 includes only self-driving vehicles, and the related greenhouse gas emissions are categorized as Category 1, so no relevant data is available.
Energy Conservation and Carbon Reduction
In 2024, Formosa Laboratories continued replacing equipment with high energy consumption. The estimated annual electricity savings reached 1,740,710 kWh, and the carbon reduction could amount to approximately 825.096 tons of CO2e. Additionally, the Phase 2 solar power generation facilities were completed in December 2024. The subsequent self- generated and self-used electricity was expected to reach 966,902 kWh annually, with ongoing carbon reduction benefits. Moving forward, we will keep implementing energy-saving projects, promote environmentally friendly and green practices during daily office activities, and evaluate and purchase renewable energy to reduce electricity consumption each year, achieving our goals of energy saving and carbon reduction.
▼Estimated performance of energy conservation and carbon reduction action plans at Formosa Laboratories in 2024

Note:
- The energy conservation action plans listed in the table above mainly focus on electricity saving, while the scope of carbon reduction includes Scope 2 greenhouse gas emissions.
- The amount of energy conserved was estimated by the difference in electricity usage before and after implementing each action plan, then converted to megajoules using the formula: 1 kWh = 3.6 MJ.
- Reduction amounts were calculated based on the following formula: Amount of electricity saved (kWh) X Electricity carbon emission factor published by the 2024 Energy Administration, Ministry of Economic Affairs (0.474 kg of CO2e per kWh of electricity), which were rounded to three decimal places.
Greenhouse Gas Emissions
The Company initiated a greenhouse gas inventory in compliance with the Ministry of Environment's regulations in 2021. In 2022, the Company conducted a greenhouse gas inventory with the boundary of entire Formosa Laboratories (the Louchu Plant and Louchu Plant 2), using the methodology of GHG Protocol and the latest version of the international standard ISO 14064- 1:2018. The Company plans to commission a qualified third-party verification organization in 2023 to verify greenhouse gas emissions and obtain an ISO 14064-1 greenhouse gas verification statement. In the future, the Company will conduct annual greenhouse gas inventories and verifications, set specific reduction targets for greenhouse gases, and use 2022 as the base year for annual reduction progress reviews.
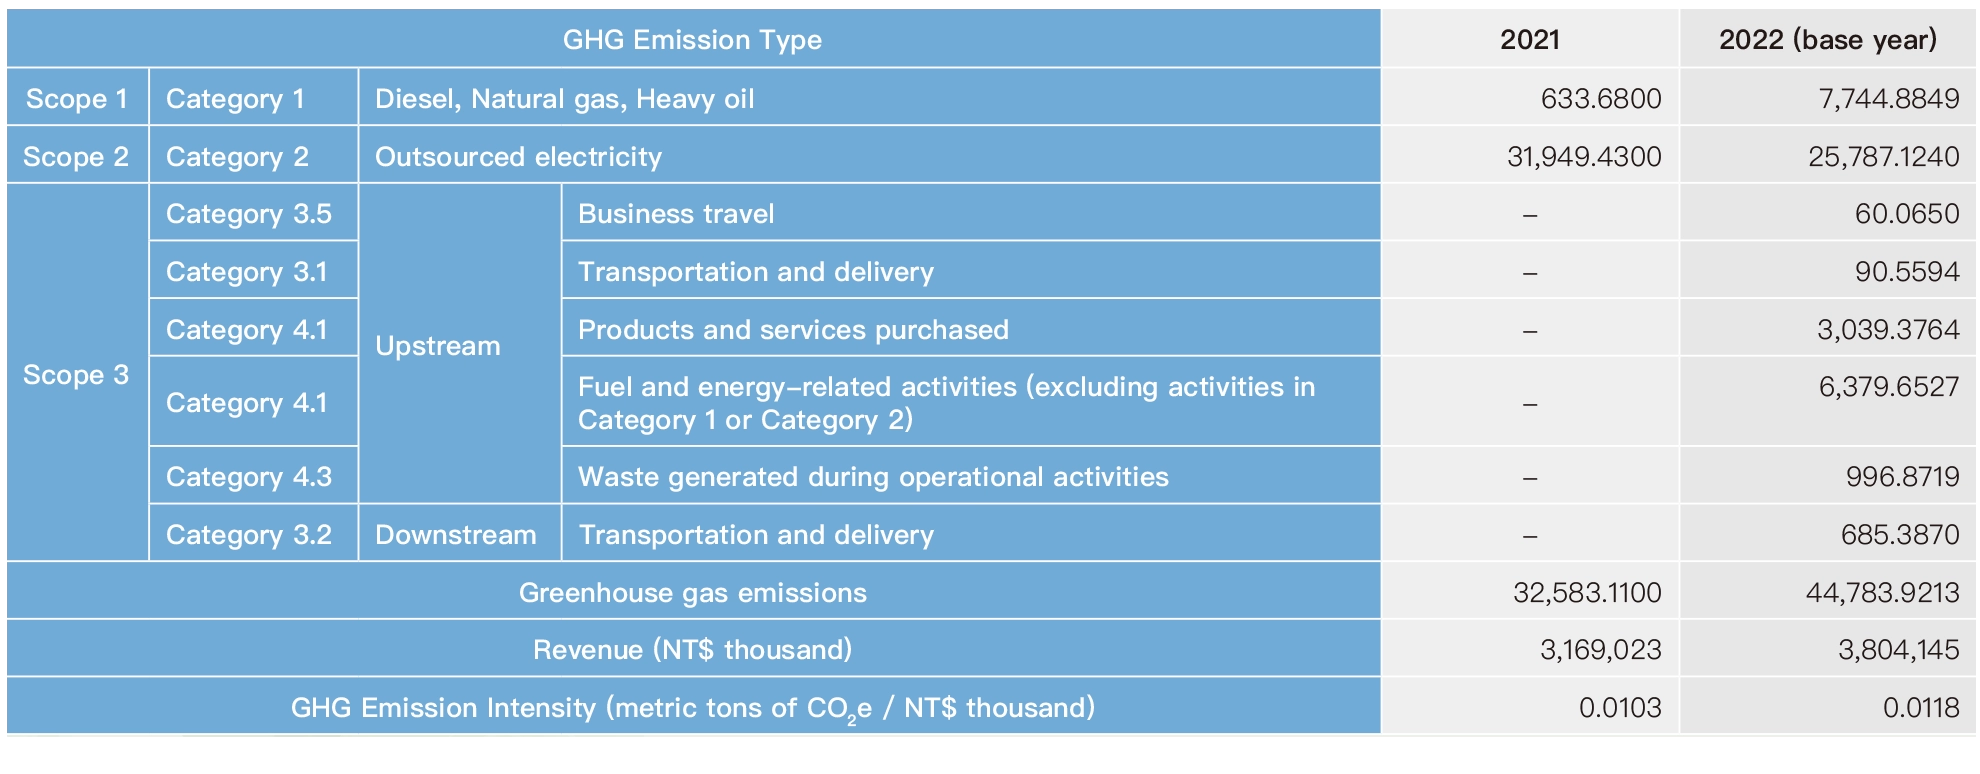
In 2022, the greenhouse gas emissions of Formosa Laboratories are as follows: Scope 1(Category 1) emissions are 7,744.8849 metric tons; Scope 2 (Category 2) emissions are 25,787.124 metric tons; Scope 3 (Category 3 to 6) emissions are 11,251.9124 metric tons, totaling 44,783.9213 metric tons. Due to the greenhouse gas inventory and calculation for the year 2022, which was conducted in accordance with international standards, the data is more complete than before 2021. No further explanations of the differences are provided to avoid distorting comparisons.
GHG Emissions of Formosa Laboratories in the Past Two Years
(unit: metric tons of CO2e)

- The greenhouse gas emissions are compiled using the operational control method, following the methodology of ISO 14064-1:2018 for inventory. The investigation of items in Scope 3 (Categories 3 to 6) is only conducted for certain items in Categories 3 and 4; however, the data for Scope 3 has not been investigated in 2021, and thus relevant information has not been included in the statistics.
- The GWP of each greenhouse gas is based on estimated values from the IPCC's Assessment Report 6 (AR6) that differ from the coefficient in the AR4 version reported to the Ministry of Environment. These differences lead to variations in the data.
- In 2021, the carbon emission coefficient for electricity is 0.509 tons CO2e/kWh. As for 2022, the carbon emission coefficient for electricity is 0.495 kg CO2e/kWh.
- GHG emission intensity calculation formula: Total GHG emissions (metric tons CO2e) / revenue (NT$ thousand).
Energy saving and Carbon Reduction
Formosa Laboratories currently employs multiple paperless management systems, which not only improve operational efficiency but also reduce paper waste. The initial implementation of the Business Process Management (BPM) system starts with procurement, followed by the relevant requirements from each department. Currently, most processes are online and nearing completion. This will approximately save 65,800 A4 papers annually. Agilent GC/LC's Product Analysis Reports can be attached directly to the LIMS (Lab Information Management System) as electronic files, eliminating the need for paper printing and saving approximately 268,500 A4 papers annually. The launch of the Document Management System (DMS) in 2023 is expected to save approximately 19,600 A4 papers annually.

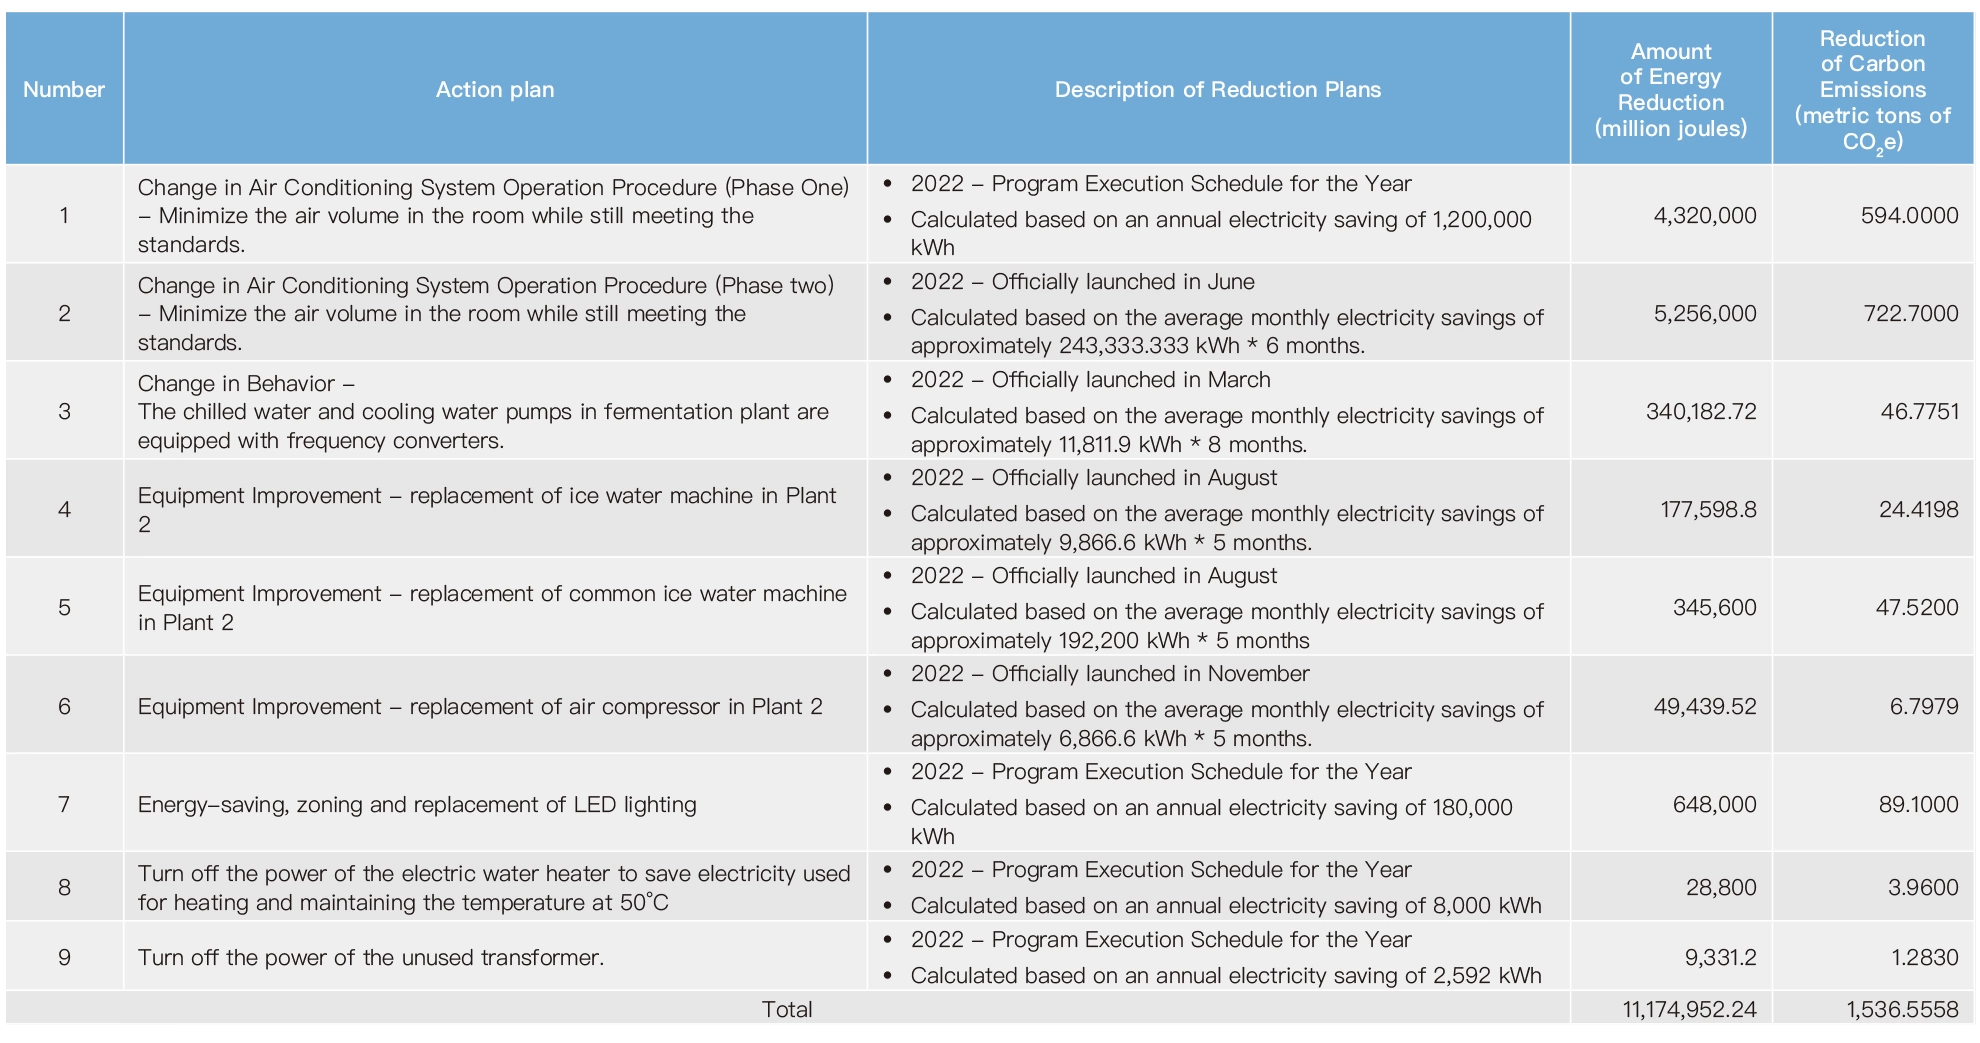
2022 Formosa Laboratories Saving and Carbon Reduction Action Plan Performance

Note:
- All types of energy-saving listed are electricity; the scope of carbon reduction refers to Scope 2.
- The energy savings are calculated based on estimated electricity savings before and after implementing each action plan, taking into account the average monthly electricity savings and activation time. The electricity savings for 2022 will be estimated and then converted into million joules using a conversion factor of 1 kWh = 3.6 MJ.
- The carbon reduction is calculated based on the saved electricity consumption * the carbon emission coefficient of electricity. The emission coefficient used in the calculation is 0.495 kg CO2e/kWh, as announced by the Bureau of Energy, Ministry of Economic Affairs in 2022. The value has been rounded to the fourth decimal place.